Sometimes you may run into problems when debugging tricky code. This is the case especially with microcontroller code if you are implementing a bootloader+firmware image solution. Debugger started in bootloader goes haywire and displays garbage or nothing at all when jumping to firmware.
Normally one should invest some time in getting debugger symbols aligned properly with source code, but if there are for example some barring deficiencies in environment or debugger UI, one can still figure out a bit more what is going on by using spare register values. Following shows a somewhat obvious, but still possibly helpful technique in brief for aforementioned debugging situations.
UPDATE 2021-08-16:
To get the job actually done, see my follow-up post
But in any case, the rest of the earlier post is here for posterity.
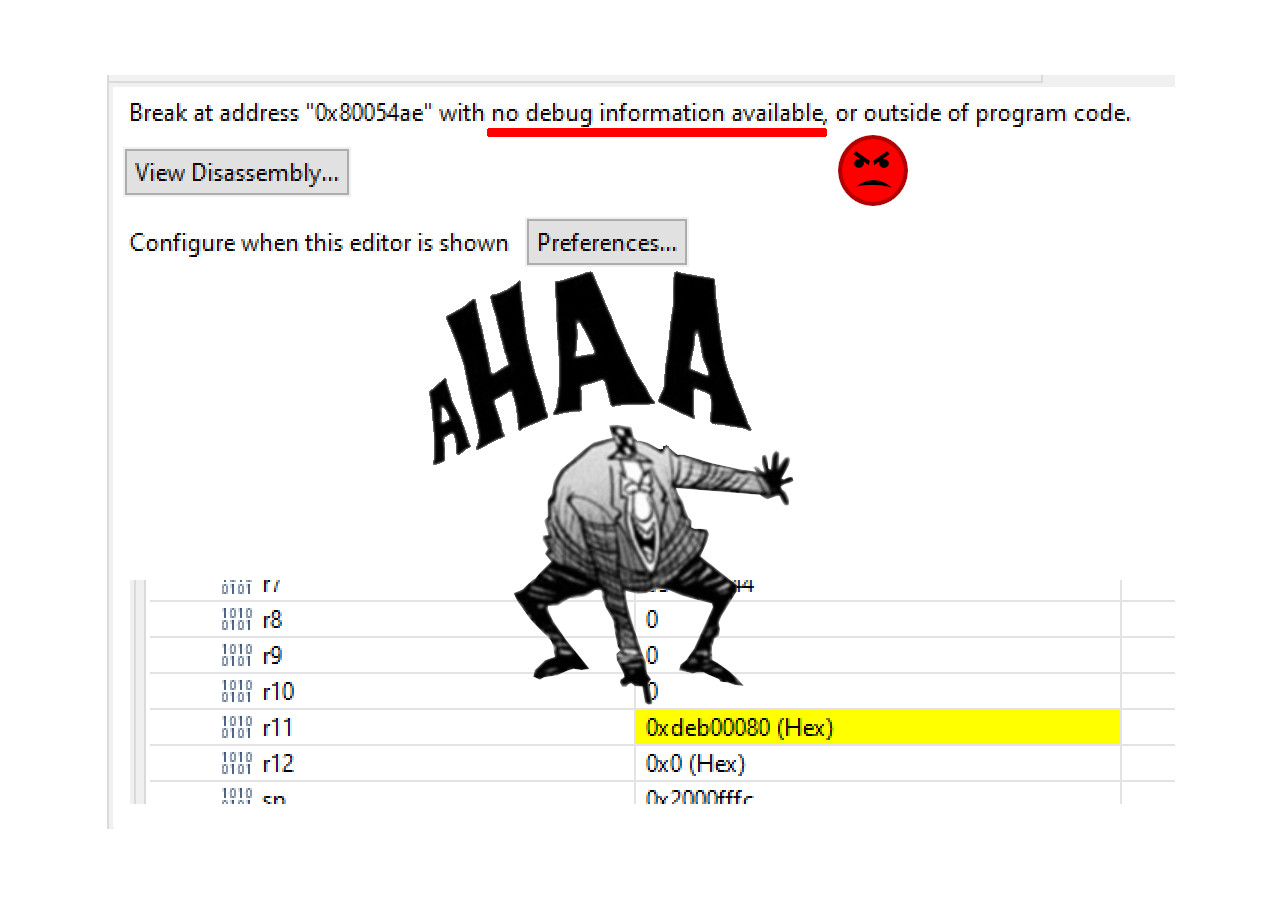
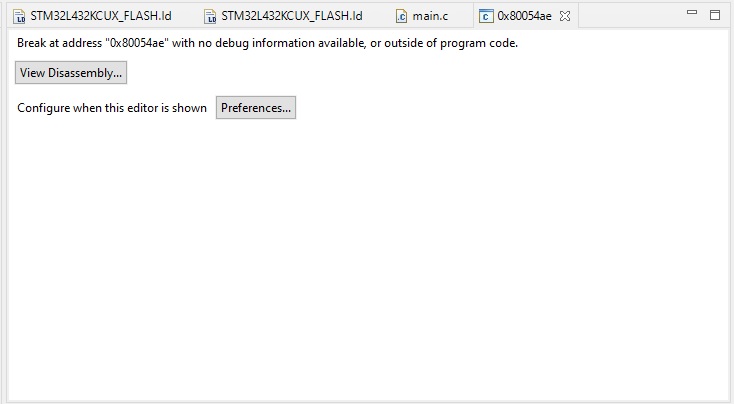
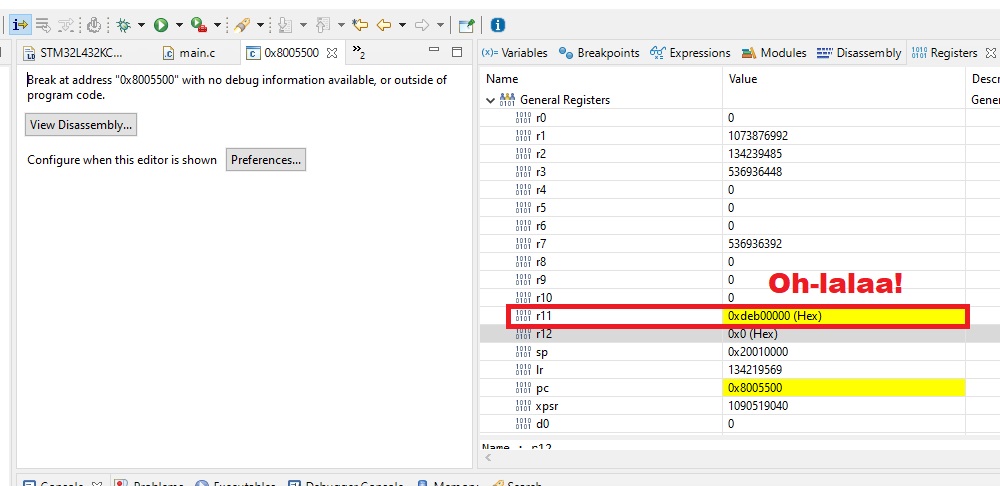
In case you are in same kind of situation as me, you probably have found the following screen all too familiar:
However, if we set the instruction stepping mode, we can still see the actual assembly code:
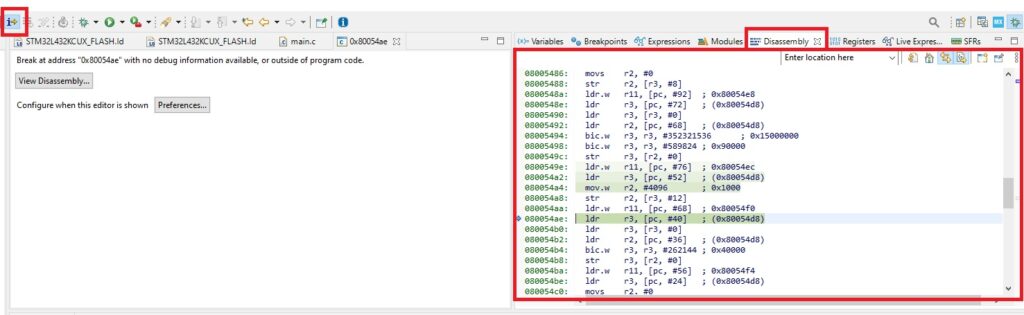
So, processor is running and it is still reading and running the machine instruction list, if you will. The problem many times becomes, where it actually is and what values is it seeing.
Luckily there is a small fix to this, in case one cannot get the debugger to fetch right debug symbols to right offset.
We can use individual MCU registers to convoy minimal debug information. The amount available depends on the processor, naturally. I am running myself Cortex-M4 core, from STM32 Nucleo-L432KC evaluation board. Register map (visible while debugging from a tab) looks like this:
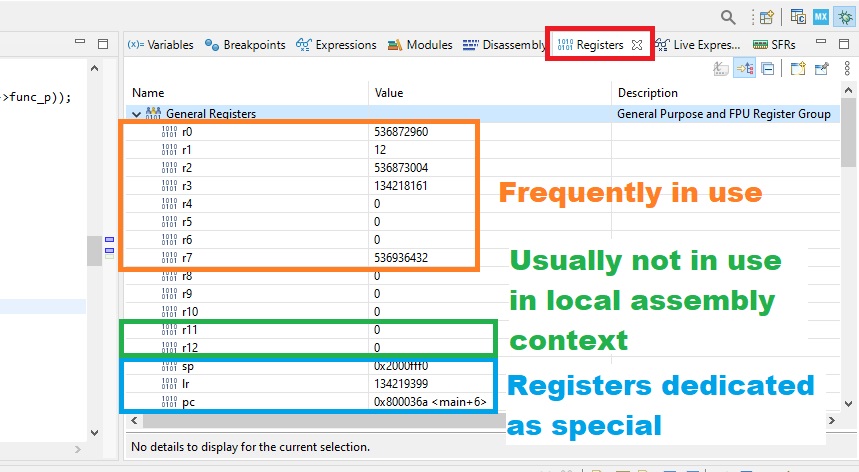
The actual map is longer, but this is enough for our purpose.
As described in the picture, on Cortex-M4 (and many others) we have basically the “normal registers” r0 – r12 available to us. While taking a look at the machine code generated, we can quickly see that registers r0 – r7 are frequently used. Then we have the friend zone r8 – r10 where usually (with varying degrees of usuality) nothing happens.
But then we have the r11 and r12 registers. They are very, very, very unlikely to be present in local assembly contexts, so we could in theory pass information via them.
But how do we do this? We can inject simple assembly instructions ourselves. Take a look at this MCU startup assembly code:
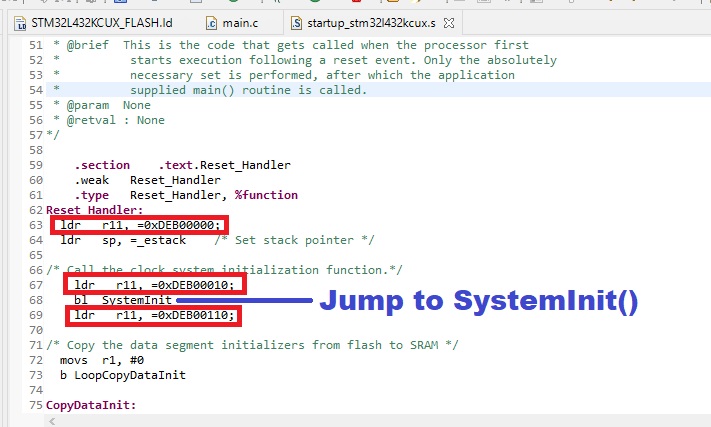
By using simple assembly instructions, like
ldr r11, =0xDEB00110;
we are able to see where we are at the code.
The previous was in pure assembly section. How about actual C functions? The same way, we just use a specific function to lace in our debug info:
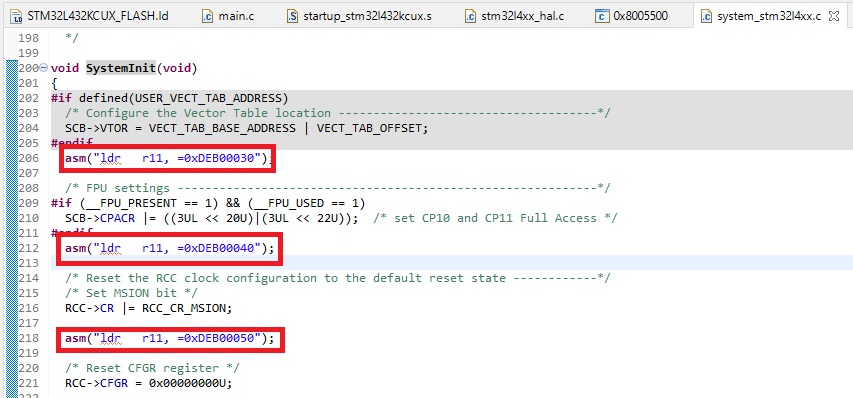
As we can see, first code line we used was
asm("ldr r11, =0xDEB00030");
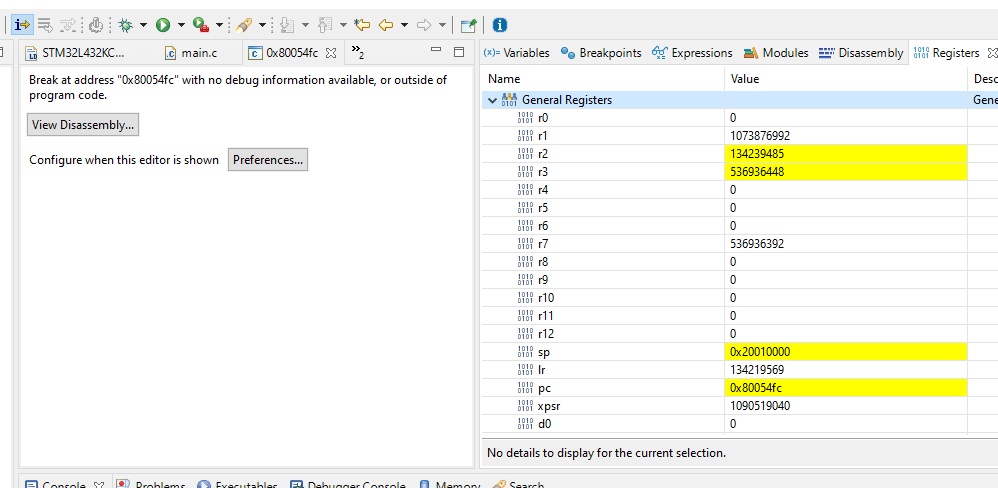
Next a little bit of suspense. What happens if we start the debugger and enter the “unknown” code one assembly instruction per time? Lets see. After selecting “Instruction Stepping Mode” and register view and then at jump point stepping with F5 one instruction a time, we end up in place unknown to debugger:
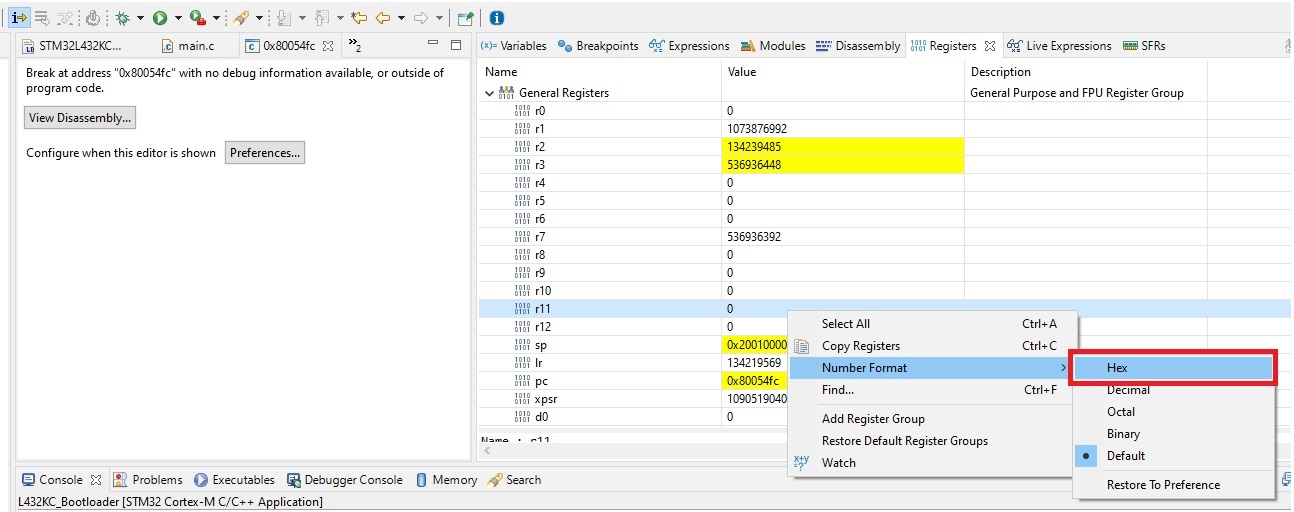
At this point it is best to ser r11 and r12 to hex display mode:
Stepping a bit further reveals a surprise:
We found our “custom debug symbol”! This tells us that jumping to the setup section (Reset_Handler) of the “unknown” code worked!
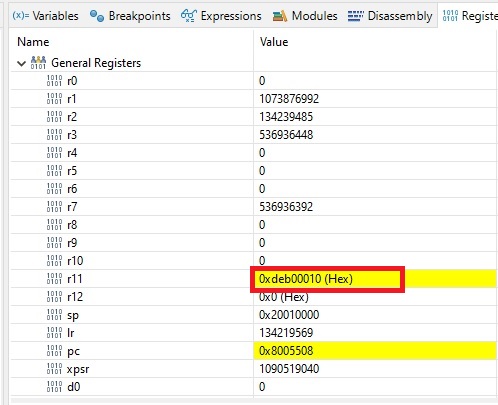
Hitting F5 couple of times get us 0xdeb00010. It means that setting the stack pointer was successful. Somewhat important information.
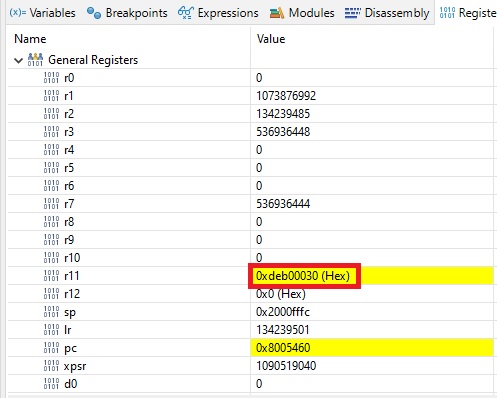
Hitting F5 enough gets us to 0xdeb00030. This is great! It means we successfully jumped to the C function SystemInit() showed earliler.
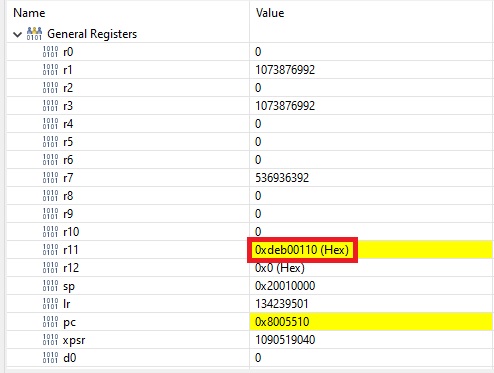
Eventually we get to0xdeb00110, which is great information, because it tells us that we successfully jumped back to caller!
There is one additional trick to this all. Remember the r12 we have been neglecting? It can be used in parallel with r11 to show information.
Here for example we load the address of the location of label __libc_init_array we are going go to and put that information to r12. So when r11 shows 0xdeb000170, we step one assembly instruction further and see that we are going to try to call code at address 0x80018cd:
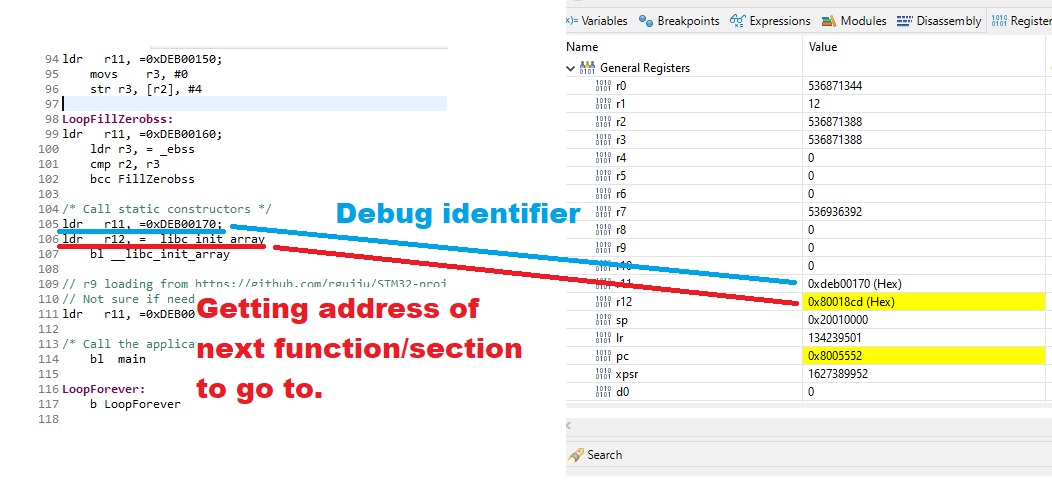
(This is wrong for my use case, because I link stuff beginning to 0x8000000 but flash it to 0x8005000 as I am experimenting with creating bootloader+firmware system where firmware can be anywhere. Now I can inspect the problem and see if I can patch it.)
As a general hint, one should use symbols of the form 0xdeb00010, 0xdeb00020, 0xdeb00030 etc, so in case you need to put more info somewhere in between, you still have some numbers left.
But wait, there is even more…
With a bit of trickery it is possible to break to code position when a register changes. Lets see how it happens.
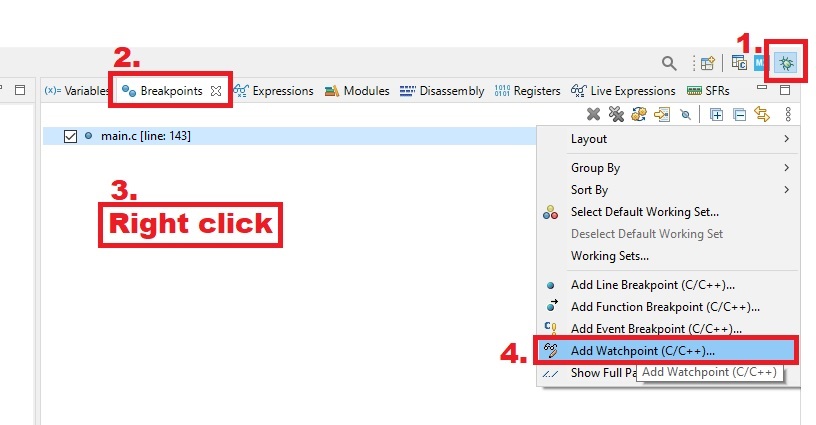
Select debug view, breakpoints, right clcik and select from context menu “Add Watchpoint (C/C++)”:
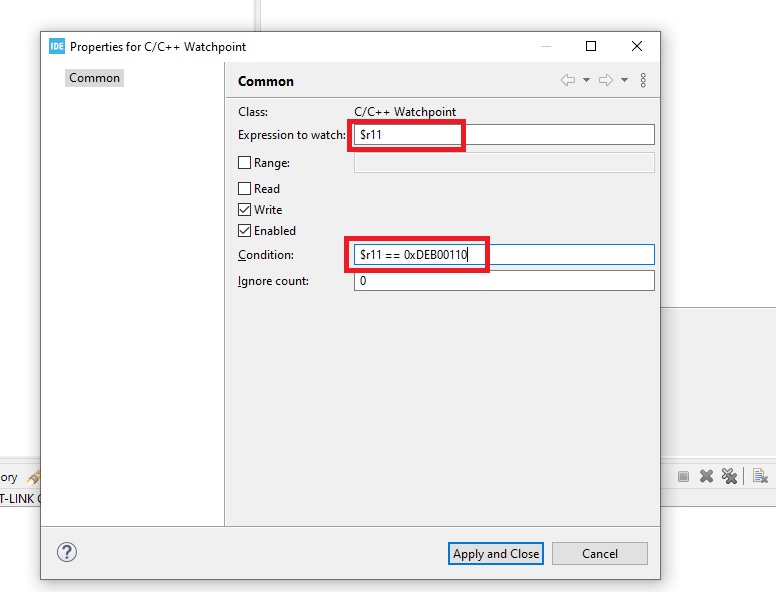
Then write the details. Strangely, in this screen you need both fields; the expression to watch and condition. I used these values:
$r11
and
$r11 == 0xDEB00110
This signifies to stop when register r11 reads 0xDEB00110 .
Next we actually disable the watchpoint because slows down the debugger if continuously running:
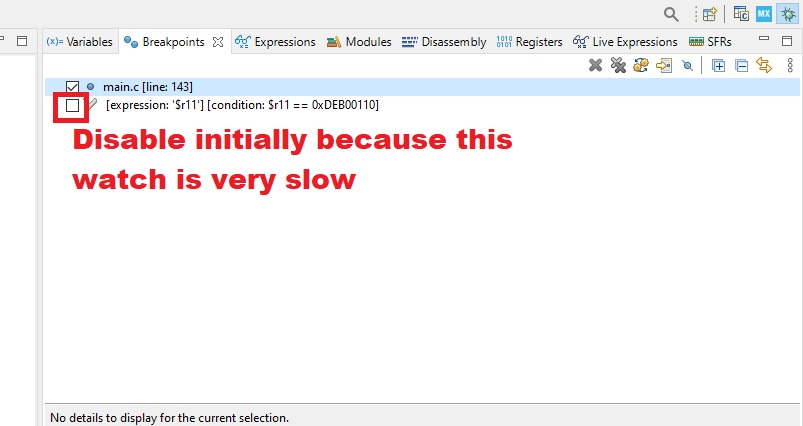
Next we start the known code and just before jumping to the “unknown code”, we enable the watchpoint:
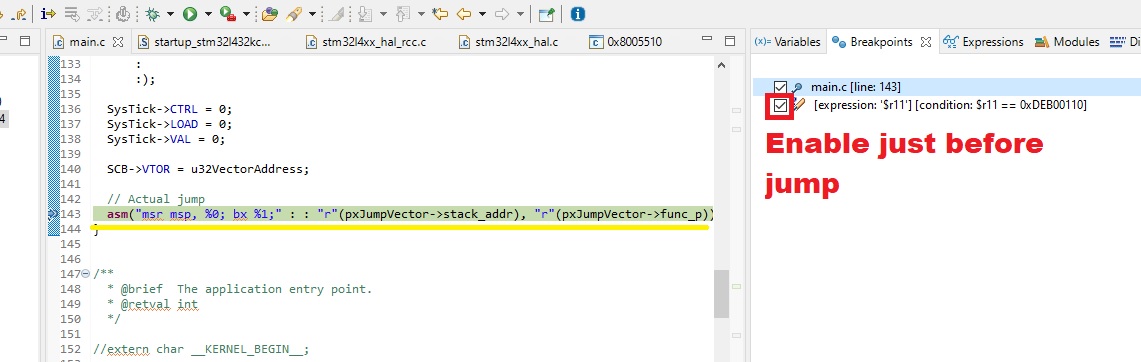
Then we wait a bit, and finally get to the position of our debug identifier! Now we can correspond a bit easier the live assembly code to the code written.

As we saw, emitting custom debug symbols via registers can be somewhat useful debug tool if and only if nothing else works. Usually it is best to invest some time to explore how to get the actual debug symbols lined up in the program.